
You think you know your top performers. The Glock 19. The Sig P365. The stuff that moves.
You're probably right about the volume. But volume is not margin. And margin is the only number that actually matters.
Do you know which products are making you money vs. just moving inventory? Do you know which distributor is actually profitable to order from? Do you know what percentage of your shelved inventory hasn't sold in 90 days?
If you're running your buying decisions off gut feel, a conversation with your rep, or a quick scan of what's low on the shelf — you're flying blind. And in a margin-compressed environment where every freight charge and distributor markup erodes your take, that's an expensive way to operate.
The Problem With Gut Feel
Your gut knows what sells. It does not know what's profitable.
You've got rifles moving at decent velocity, but after you back out freight, distributor markup, and your cost to carry them, the margin might be 8%. You've got a slower-moving line of optics that nobody talks about — but every unit clears 30% margin. You're spending more time and shelf space on the first category because it looks busier.
That's the trap. Busy is not the same as profitable.
The same problem shows up with distributors. You've ordered from RSR for years. Great relationship. But have you ever actually run the numbers on what your average margin looks like on RSR-sourced products versus Lipsey's? Or Sports South? Different distributors price differently on different categories. Without data, you're picking based on habit.
And then there's dead stock. Every store has it. Products that came in, went on the shelf, and have been sitting there aging. That inventory is not neutral. It's costing you. It's tied-up capital, it's shelf space that a better-performing product could occupy, and eventually it's a markdown.
What Sales Intelligence Shows You
Sales Intelligence is a suite of six dashboard pages inside Mission Control, built directly on top of your own Odoo sales data. No external feeds. No CSV imports. No third-party analytics tool you have to pay extra for and learn separately.
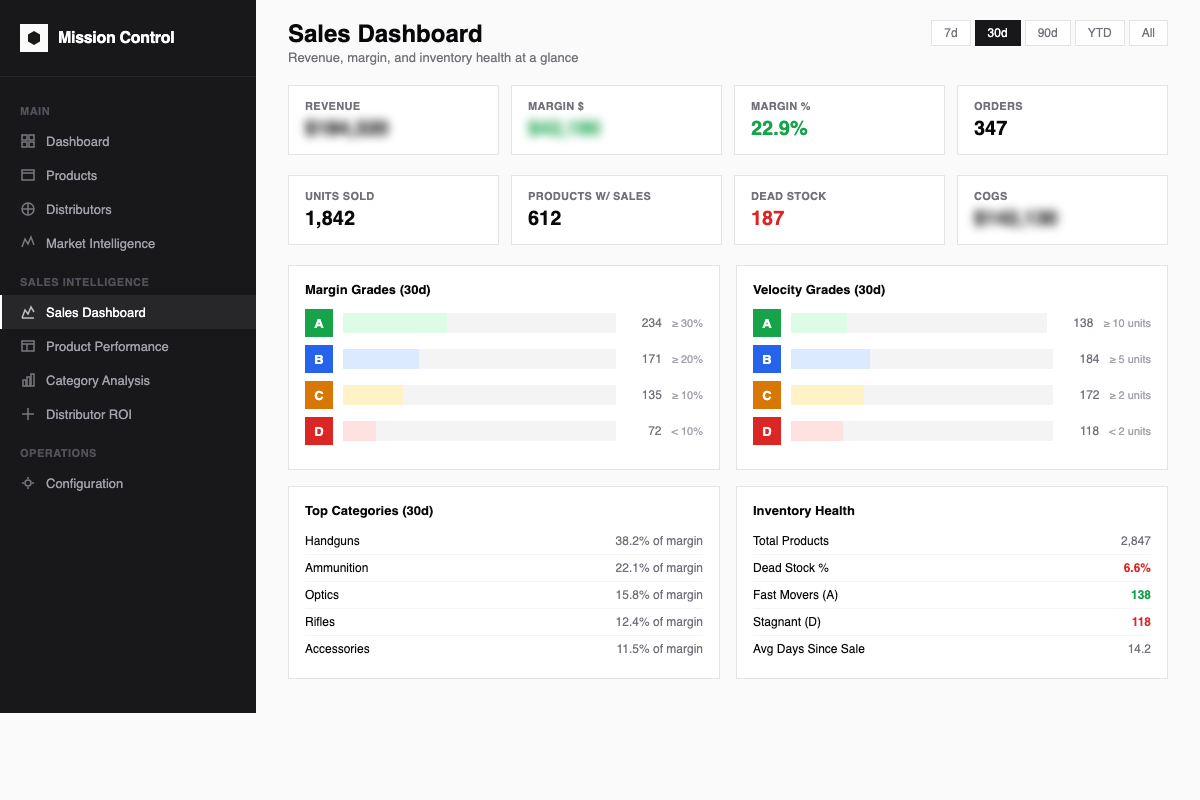
The Sales Dashboard gives you revenue, margin, grades, and inventory health at a glance.
The Sales Dashboard gives you the high-level view: revenue, margin dollars, margin percentage, units sold, orders, and dead stock count. It grades your inventory across two axes — margin grade (A through D) and velocity grade (A through D). You can filter by time period — 7 days, 30 days, 90 days, year-to-date, or a custom range. This is your morning check. Two minutes and you know if the business is healthy.
Product Performance is where you dig into specifics. Every product, sortable by revenue, margin percentage, units sold, velocity grade, margin grade, or days since last sale. Want to see everything with a D margin grade that's also a D on velocity? That's your liquidation list. Want to see your A/A products — high margin, high velocity — so you know what to never run out of? That's your priority reorder list.
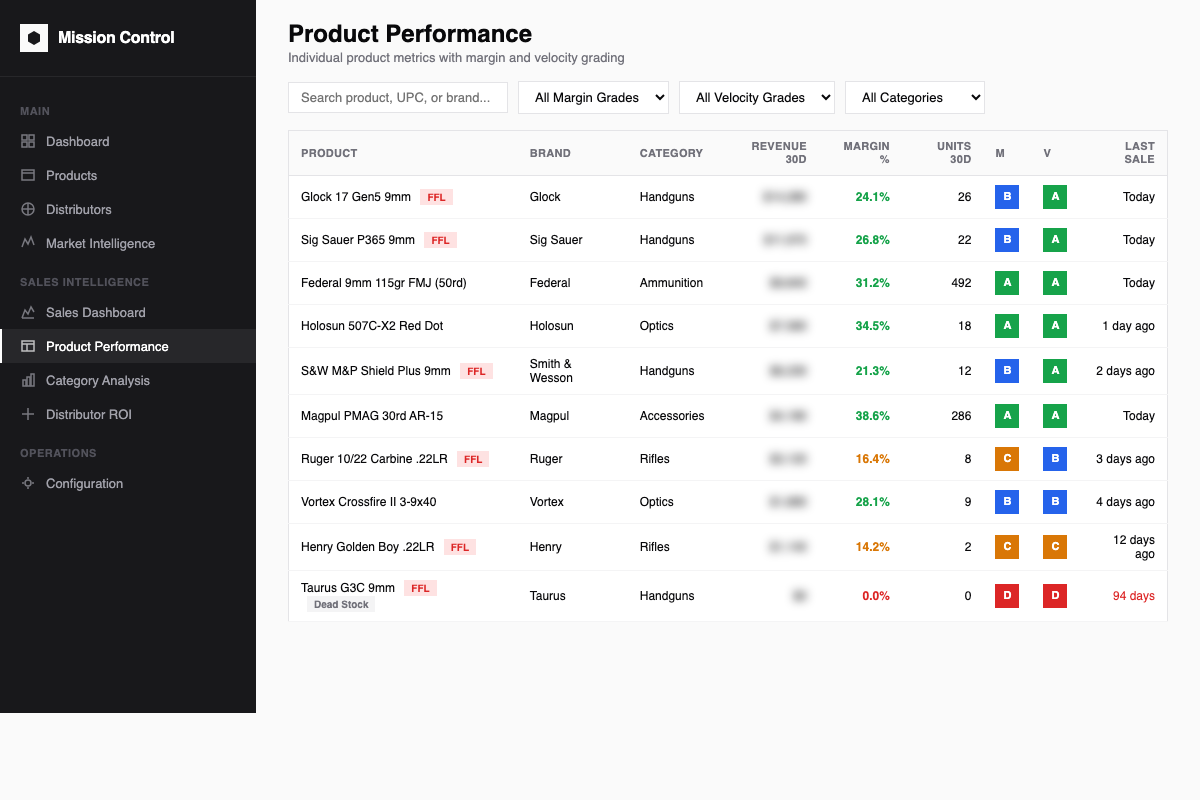
Product Performance shows margin and velocity grades for every SKU, with dead stock flagging built in.
Category Analysis breaks everything down by product category. Which categories are driving margin, which are driving volume, and which are just filling shelf space.
Distributor ROI is the one that tends to surprise people. Revenue, cost, margin, units, average margin percentage, and ROI percentage — broken down by which distributor the product was sourced from. You might find out that one distributor you use out of habit is consistently your lowest-margin source.
Purchase Forecast uses a linear regression on your daily revenue and unit data to project forward 30, 60, and 90 days. It tells you the trend direction — up, flat, or down — and the slope of that trend.
The Grading System
Margin grades: A is 30% or better. B is 20% or better. C is 10% or better. D is under 10%.
Velocity grades: A is 10 or more units sold in the past 30 days. B is 5 or more. C is 2 or more. D is under 2.
Combined, these tell the full story. An A/A product is your golden child. A D/D product is a candidate for a different conversation. Dead stock is defined as any product with no sales in the past 90 days.
This Is Your Data. You Should Be Using It.
The data already exists inside your system. Every sale you've ever made in Odoo created a transaction record. Sales Intelligence takes those records and surfaces them in a way you can actually act on.
Every morning at 8 AM, the system recalculates metrics from a snapshot taken at 7:30 AM. Rolling windows of 7, 30, and 90 days. Twelve months of history. It works automatically. You just have to look at it.
The stores that win on margin are the ones that make buying decisions based on what the data says, not what the rep is pushing this month or what looked good at the last trade show.
Want to see Sales Intelligence in action? Schedule a demo at missioncriticalbps.com and we'll show you what your own data looks like when it's actually organized.